This blog is about how the world stock markets perform and which way they will take next.I have developed my own technical tools during 30 years to give the investor early warnings for coming big changes in the main trends and for the trader to take positions before the markets react.
Click all charts.
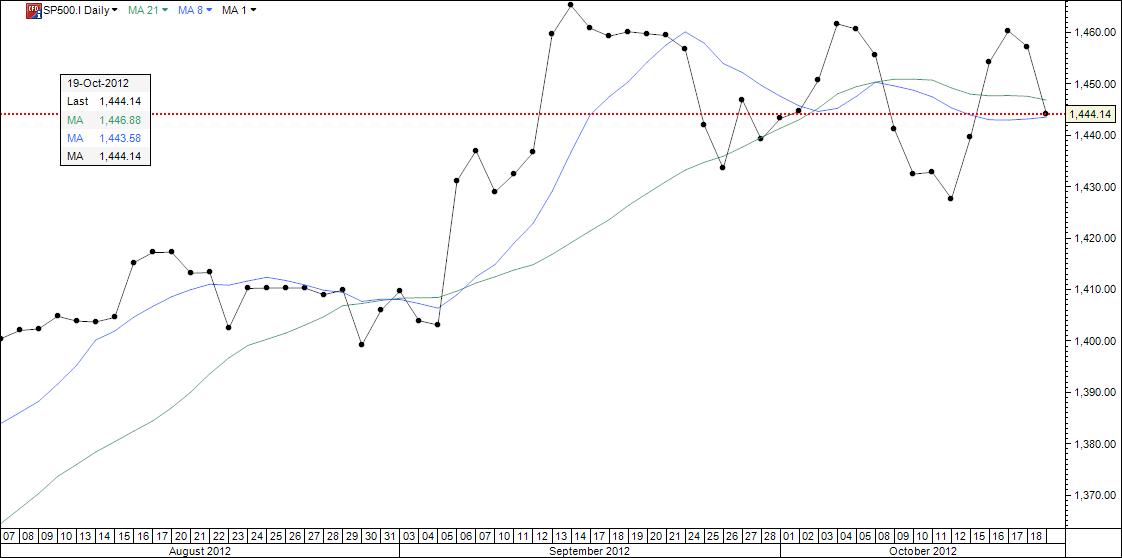
19/10/2012
All main indexes are falling, so far 8 week rising MA gives support. Here is SP500 daily and 2 hour chart just now
SP500 daily chart with dots marking the closes. Observe that there are lower highs an lover bottoms which is bearish.

No comments:
Post a Comment