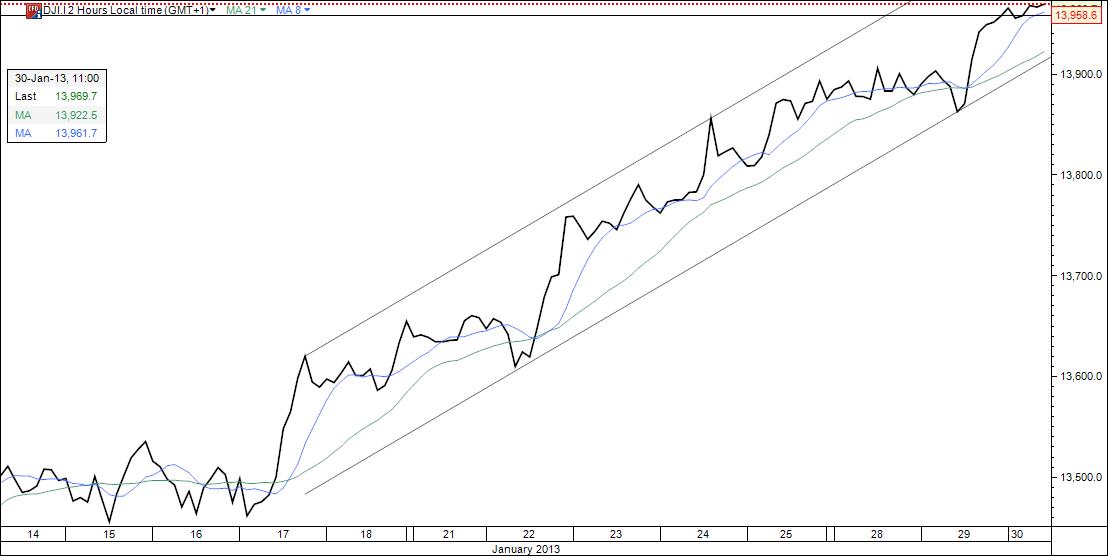
31/01/2013

DOW 2 hr trend still down. Could easily rally or drop.

DOW 2 hr 13:04

This is last day of the month and the close is very important for the long term charts and especially what will happen the days after.

DOW working to test days low again

DOW 15 min 12:02

SWED did not make a key reversal. Top is being tested again and the big R line number one.

SWED month 11:25

SWED has made a a key reversal so far in the last bar that closes 11:00. That could be a sign that the top is reached.

SWED 2 hr 10:31

FTSE is now testing the S point on downside and the DAX is also in a downtrend

FTSE 2 hr 10:19


DAX 2 hr 10:20

DOW day and 15 min gives a good picture of what is going on.

DOW day 10:07

The long uptrend is very well in place and the 8 MA should give support on a drop


DOW 15 min 10:09

After the big drop a 5 wave correction up trend has been done without reaching the small R points top before the uptrend. It is possible that the downside pressure will get stronger soon.

DOW is seeking support above S line.. Lots of US news at 14:30 and at 15:45 that can move the markets.

DOW 2 hr 09:43

Dow 8 hr MA is still keeping the bars below its line but there is support above the technical S line. Asia and Europe are not keen to trade the Dow. The 21 MA has not start falling yet and a sudden rally could easily destroy the downtrend which has been sideways for many hours now.

30/01/2013

FTSE falls out of channel and takes new daily low at 6.312

FTSE 2 hr 21:28

DOW takes new daily low at 13.909

DOW 2 hr 21:18

DOW 2 hr 8 ma turns down but still support at rising 21 MA.

DOW day 16:59


DOW 2 hr 17:04

Trading range now between the MA;s that is 13.930 and 13.956.


DOW 15 min close below S line.

Dow 15 min 16:35


DOW 2 hr 8 MA is currently down but the 21 MA should give support.

DOW 2 hr 16:16


DOW 1 hr trend is close to down but no cross yet.

DOW 1 hr 16:07

Dow fell before hourly close making the 8 MA pointing down but only close to cross. At 20:15 the Fed will tell their rate decision.

DOW rallies

DOW 30 min 15:46

Here comes the rally which gets above the 30 min downtrend without problems

DOW 30 min trend is now down with both 8 and 21 MA down.

DOW 30 min 15:36

If the rate is holding around this area the 1 hr trend will be down at 16:00. But remember that the 2 hour trend with cross and 8 and 21 MA down is the safest sign to avoid big rallies to new high. Smaller trends can often easily be taken out.


DOW now trading at exactly US close yesterday waiting for opening in 14 minutes.

DOW 15 min 15:15

Look again at this picture and ask yourself what had happened if you had no stops. Most certainly a smaller loss then with a "safe" stop. I have not used stops since 1987 because I lost to much. You should know the direction of the trend and how it will move so you never need a stop. Otherwise you should not trade. The biggest money to earn is to find a long term top or bottom and stay in for a year or more. That goes for currencies and gold as well. Do never "take home" the profit because the big difficulty is to find the buying or selling point again and again. It happens that I can wait for more than 2 years to find the exact point for my position.

DOW is attacking R line from above on close.

DOW 15 min 14:50

Observe that the big drop only resulted in a close above the earlier low close. Now the bears want a 15 min close below the S line.

A sudden drop took out long positions and confirmed the sell signal earlier

DOW 15 min 14:34

Here is another important piece of remembrance.  When it has become clear that the cross is real then the professionals send the market as high as they can above the falling MA:s and sell the top to get short positions. Always wait for that run to take your own short positions. In this chart it is the bar second from the left. 

DOW sideways to down now. A reminder when trading US indexes.

DOW 15 min 14:12

 Monday at 22:00 the DOW closed at 13.886. Tuesday Europe got a low at 14:00 at 13.857 - that is below the close in the US. Sideways for a while and then the 8 MA turns up and later crosses the 21 MA on upside (upside cross) starting a strong rally until 30 min before US closed at 13.968. Very very often this happens when the trend is below yesterdays close in the U.S. at opening. A US short covering starts which can be powerful as yesterday. In these situations be very careful, that is my message.


DOW sell signal 15 min chart on cross.

DOW 15 min 13:54

DOW from 2 hr close perspective now

DOW 2 hr 11:59

DOW sideways trend seems to move down in 15 min chart. News USA at 14:30 GDP and 20:15 FOMC Rate Decision

DOW 15 min 11:35

SWED moves strongly despite new day gap and target seems to be the channel top.

SWED week 11:20


SWED day 11:21


SWED 2 hr 11:22


SWED 15 min 11:23

EURO taking new highs in strong uptrend

EURO month 10:48


EURO week 10:49


EURO day

SP500, NAS, FTSE, DAX, SWED monthly diagrams now

SP500


NAS


FTSE


DAX


SWED


DOW has taken a new high, 13.972.7 and is now holding above R line 13.958.6. Road is now open to all time high at 14.193.5

DOW 15 min 09:23


DOW month 09:41

29/01/2013

DOW takes new high last hour at 13.968.4 but closes down below R line 13.958.6 at 13.951.6. All trends are up at close.

DOW 1 hr Tuesday close

EURO takes new 60 weeks high at 1.3496

EURO week 19:48


DOW 2 hr 19:52

No double top but a fourth wave, target seems to be first R point at 13.958.6

DOW 15 min 19:07

DOW eventual double top.

DOW 15 min 19:01

Dow closed with a double top. Watch up

SP500 new high weekly. R lines comes from weekly chart 2007

SP500 week  18:40


DOW 15 min 8 MA is rising and giving support for eventual a new leg on upside.

DOW 15 min 18:18

DOW has taken new high over high channel at 13.944.5 but below first R at 13.958.6 and all time high at 14.193.5

DOW weekly 17:55


DOW week top 2007

Here starts the R lines.


DOW 2 hr 18:05


DOW 15 min 18:06